For a better view of the website, update your browser.
Those browsers has new features built to bring you the best of the web.
Explore Menu
West Bay Seven Mile Beach Seven Mile Corridor East Interior George Town South Sound Prospect/Spotts Savannah / Lower Valley Bodden Town / Breakers East End / High Rock North East Coast / Colliers North Side Rum Point Midland East Duck Pond Cayman Brac West Cayman Brac East Cayman Brac Centre Little Cayman West Little Cayman East
  • Grand Cayman
  • Little Cayman
  • Cayman Brac
Districts List
  • West Bay
  • Seven Mile Beach
  • Seven Mile Corridor
  • East Interior
  • George Town
  • South Sound
  • Prospect/Spotts
  • Savannah / Lower Valley
  • Bodden Town / Breakers
  • East End / High Rock
  • North East Coast / Colliers
  • North Side
  • Rum Point
  • Midland East
  • Duck Pond
  • Cayman Brac West
  • Cayman Brac East
  • Cayman Brac Centre
  • Little Cayman West
  • Little Cayman East
$
$
Reset

Market Report 2018

Continuing its legacy of providing insightful market updates, the CIREBA is delighted to release the 2018 Property Market Review. This comprehensive report captures the pulse of the real estate scenario, spotlighting key shifts, opportunities, and trends within the Cayman Islands.
01 Jan, 2019
Market Report 2018

Continuing its legacy of providing insightful market updates, the Cayman Islands Real Estate Brokers Association (CIREBA) is delighted to release the 2018 Property Market Review. This comprehensive report captures the pulse of the real estate scenario, spotlighting key shifts, opportunities, and trends within the Cayman Islands.

Key Figures

Number of Properties 2018:

  • Active Properties: 1,452
  • Properties Sold YTD: 821, accumulating to $576,239,960 or 19.4% of the market.
  • Properties Pending: 546, amounting to $453,338,402.05, representing 12.9%.
  • Newly Listed Properties: 1,404 with an estimated value of $1,564,957,304.90.

Active Listings Average Time on Market 2018:

  • Land: 996 days, with an average price of $815,013.08, making up 32.4%.
  • Commercial: 495 days, priced on average at $1,683,105.85, accounting for 16.1%.
  • Business: 365 days, with an average price of $1,341,601.50, contributing 11.9%.
  • Multi-Unit: 608 days, average pricing at $1,434,253.75, equivalent to 19.8%.
  • Residential: 611 days, averaging at $1,469,228.96, representing 19.9%.

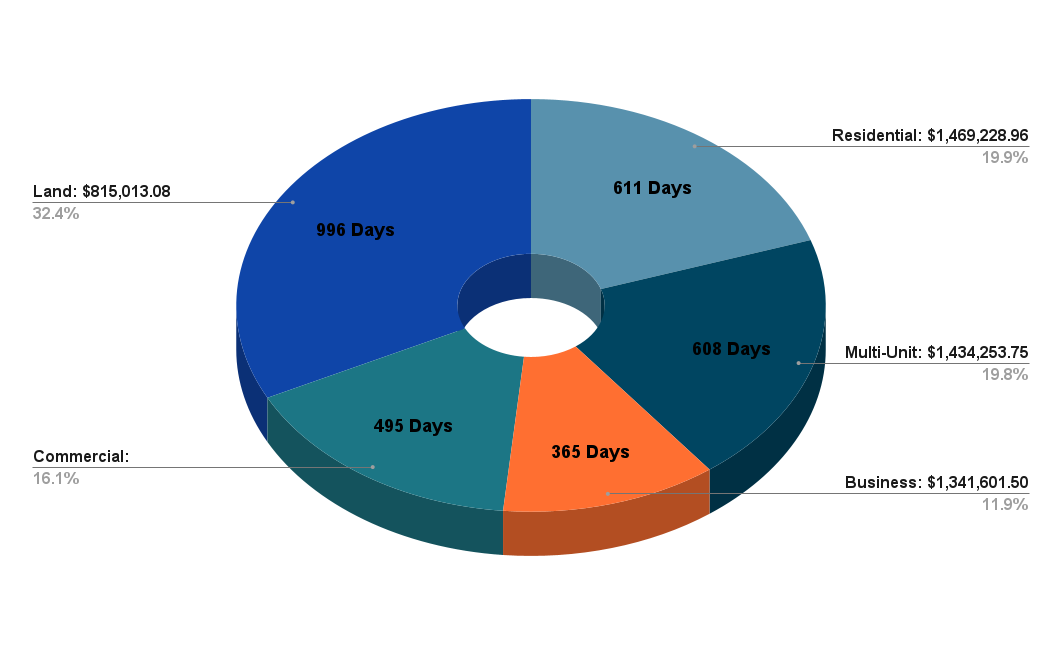
Observations and Comparisons:

1. Comparative Analysis with 2017:

  • Sales: The number of properties sold YTD in 2018, at 831, shows an appreciable uptick compared to the 2017 figure of 696.
  • Pending Sales: While the number of properties pending remained the same in both years, the total value increased to $519M in 2018 from $500M in 2017, a sign of higher-priced listings or a more valuable property portfolio.
  • New Listings: 2018 witnessed an influx of new properties, with a 16% rise from the 1,197 listed in 2017.
  • Active Listings: Active listings had a slight increase, moving from 1,466 in 2017 to 1,484 in 2018.

2. Listing Duration Insights: Land properties in 2018 saw a longer duration on the market compared to 2017, suggesting potential fluctuations in demand or supply over the year. Commercial properties, however, reduced their market time, indicating a surge in demand.

3. Pricing Variations: Notably, there were pricing variations across all segments. For instance, the land saw a price elevation from approximately $600k in 2017 to $815k in 2018.

The Cayman Islands' property market showcased resilience and growth throughout 2018. With a more diverse range of properties entering the market and the noticeable progression in sales, the future appears promising. CIREBA remains committed to facilitating seamless transactions, ensuring that both buyers and sellers receive maximum value. As we anticipate the prospects of 2019, the foundation laid in 2018 offers much optimism.

More from Market Review